
Marketing reports are about to get a major makeover in 2025. Most people think choosing a fancy template or adding more charts is the answer. Actually, the real winners are the teams who match their report format to their audience’s needs. A well structured report can turn raw numbers into a narrative powerful enough to drive every strategic decision—one study found that teams using tailored visual dashboards made decisions up to 30 percent faster. Do not just settle for the flashiest format. The smartest reports start where your audience is and end with action.
Table of Contents
- Choosing The Right Report Structure
- Key Components Of Effective Reports
- Visualizing Your Marketing Data
Quick Summary
| Takeaway | Explanation |
|---|---|
| Understand Your Audience | Tailor report structure and content based on the audience’s needs, such as high-level summaries for executives and detailed analyses for the marketing team. |
| Core Report Components | Include essential elements like an executive summary, performance metrics, campaign analysis, comparative data, and strategic recommendations to create a coherent marketing performance report. |
| Effective Data Visualization | Utilize appropriate visualization techniques (e.g., line graphs, bar charts) and interactive dashboards to turn complex data into intuitive insights that drive decision-making. |
Choosing the Right Report Structure
Selecting the optimal structure for marketing reports determines how effectively your data communicates insights and drives strategic decisions. The right format transforms raw numbers into a compelling narrative that captures stakeholders’ attention and guides actionable marketing strategies.
Understanding Report Purpose and Audience
Before designing your marketing report, identify the specific purpose and target audience. Different stakeholders require different levels of detail and presentation styles. A monthly marketing report for executives will look dramatically different from a detailed campaign performance analysis for the marketing team.
Consider these key considerations when structuring your report:
- Executive Level: Prefer high level summaries with key performance indicators (KPIs)
- Marketing Team: Want granular data and tactical insights
- Clients: Seek clear results and potential recommendations
Your report structure should match the audience’s information needs, communication preferences, and decision making context. A well structured report acts as a strategic communication tool that bridges data complexity with clear understanding.
Essential Components of Effective Marketing Reports
Successful marketing reports typically include several core components that provide comprehensive insights. While formats may vary, these fundamental elements remain consistent across best formats for marketing reports:
- Executive Summary: A concise overview highlighting key achievements, challenges, and primary metrics
- Performance Metrics: Detailed breakdown of critical marketing performance indicators
- Campaign Analysis: Specific insights into individual marketing initiatives
- Comparative Data: Historical or competitive benchmarking
- Recommendations: Strategic suggestions based on data findings
The goal is creating a marketing performance report that tells a coherent story. Data should flow logically, connecting individual metrics to broader marketing objectives. Visual elements like charts and graphs can transform complex information into easily digestible insights.
Selecting Appropriate Reporting Templates

Choosing the right reporting template streamlines your data presentation process. While numerous marketing reporting templates exist, select one that aligns with your specific organizational needs. Consider templates that offer:
- Flexibility in data visualization
- Easy customization options
- Compatibility with your existing analytics platforms
- Clean, professional design
- Ability to highlight key performance trends
Professional marketing report templates from platforms like Databox or Google Data Studio provide pre built frameworks that can be tailored to your unique reporting requirements.
Remember that no single template works universally. Experiment with different formats, gather feedback from stakeholders, and continuously refine your reporting approach. The most effective marketing reports evolve with your organization’s changing needs and communication strategies.
Ultimately, your report should answer three critical questions: What happened? Why did it happen? What should we do next? By maintaining this focus, you transform static data into a dynamic strategic asset.
Key Components of Effective Reports
Creating a comprehensive marketing report requires more than simply compiling data. The most powerful reports transform complex information into clear, actionable insights that drive strategic decision making.
Crafting a Compelling Executive Summary
The executive summary serves as the critical gateway to your entire marketing report. This concise section must immediately capture attention and provide a high level overview of key performance metrics. According to Harvard Business Review, an effective executive summary should distill complex information into 250 300 words that answer three fundamental questions: What were the primary objectives? What were the key results? What are the recommended next steps?
Key elements of a powerful executive summary include:
- Clear Performance Highlights: Showcase the most significant achievements
- Quantitative Metrics: Present concrete numerical evidence
- Strategic Implications: Connect data to broader business objectives
- Concise Language: Use direct, impactful communication
The goal is to provide busy executives and stakeholders with an immediate understanding of marketing performance without requiring them to dive into detailed report sections.
Performance Metrics and Data Visualization
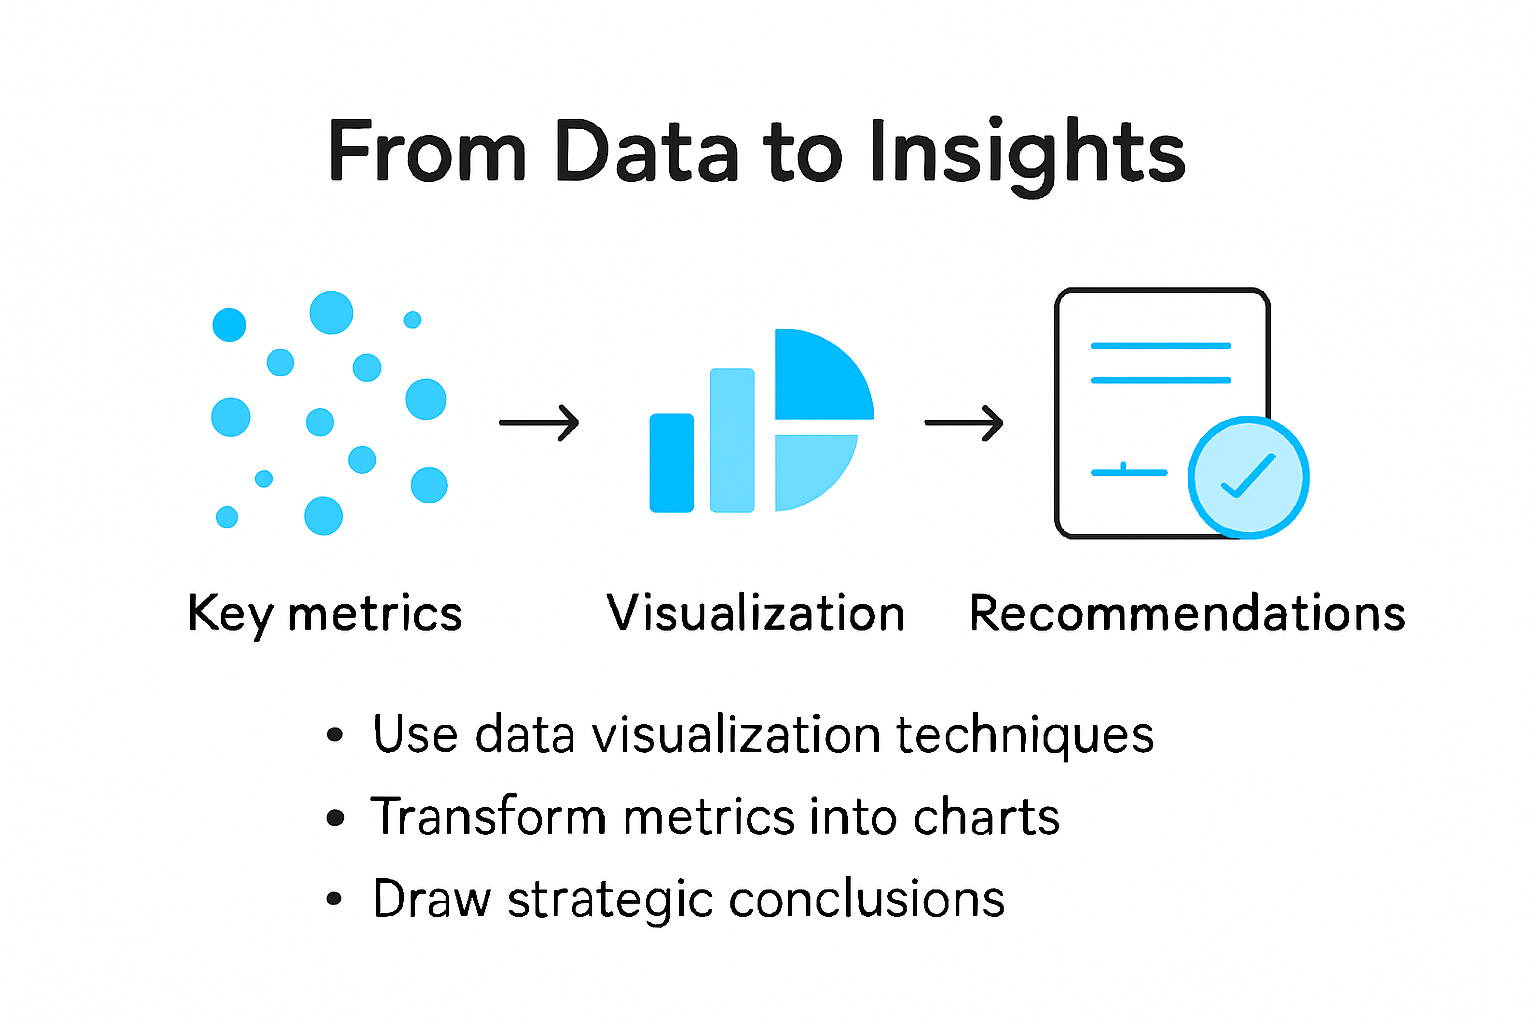
Transforming raw data into meaningful insights requires sophisticated marketing performance report techniques. Gartner Research emphasizes the importance of selecting metrics that directly align with business goals.
Critical performance metrics to include:
- Customer Acquisition Cost (CAC)
- Return on Marketing Investment (ROMI)
- Conversion Rates
- Website Traffic and Engagement
- Lead Generation Metrics
Data visualization plays a crucial role in making complex information digestible. Utilize charts, graphs, and infographics to translate numerical data into compelling visual narratives. Platforms like Tableau offer advanced visualization tools that can transform statistical information into intuitive graphics.
Effective visualization techniques include:
- Color coded performance indicators
- Trend line graphs showing progression
- Comparative bar charts
- Interactive dashboard elements
Strategic Recommendations and Future Outlook
The most valuable marketing reports do more than report historical data they provide strategic guidance. Your report should include a forward looking section that translates past performance into actionable future strategies.
Recommendation components should address:
- Identified strengths to leverage
- Areas requiring improvement
- Proposed strategic adjustments
- Potential resource allocation
- Anticipated market opportunities
This forward looking approach transforms your report from a static document into a dynamic strategic planning tool. By connecting past performance with future potential, you demonstrate the true value of your marketing efforts.
Remember that effective reporting is an iterative process. Continuously gather feedback from stakeholders, refine your reporting approach, and remain adaptable to changing business needs. A great marketing report is not just about presenting data it is about telling a compelling story of marketing performance and potential.
Visualizing Your Marketing Data
Data visualization transforms complex marketing information into intuitive, actionable insights. The right visual approach can turn raw numbers into compelling narratives that drive strategic decision making and communicate marketing performance effectively.
Choosing the Right Visualization Techniques
Selecting appropriate visualization methods requires understanding both your data and your audience. Different chart types communicate different types of information more effectively. According to Tableau, the most powerful visualizations match specific data characteristics with corresponding visual representations.
Key visualization techniques include:
- Line Graphs: Tracking performance trends over time
- Bar Charts: Comparing different marketing channel performances
- Pie Charts: Showing percentage distributions
- Heat Maps: Displaying geographic or intensity based data
- Scatter Plots: Exploring relationships between multiple marketing metrics
Consider the complexity of your data and the story you want to tell. A well chosen visualization can instantly communicate insights that would take paragraphs to explain in text.
Interactive Dashboard Design
Modern marketing reports move beyond static images toward interactive, dynamic dashboards. Domo Research highlights that interactive dashboards allow stakeholders to explore data in real time, drilling down into specific metrics and uncovering deeper insights.
Essential dashboard design principles:
- Clean, Intuitive Layout: Minimize visual clutter
- Responsive Design: Accessible across multiple devices
- Real Time Data Updates: Ensure current information
- Customizable Views: Allow users to focus on relevant metrics
- Consistent Color Schemes: Use color to guide understanding
Platforms like Google Data Studio and Power BI offer powerful tools for creating dynamic, interactive marketing report visualizations that transform raw data into strategic insights.
Storytelling Through Data Visualization
Effective data visualization goes beyond mere presentation it tells a compelling narrative about your marketing efforts. Each chart, graph, and dashboard should answer key questions: What happened? Why did it matter? What should we do next?
Strategies for creating narrative driven visualizations:
- Connect individual metrics to broader marketing goals
- Use annotations to highlight significant insights
- Create visual progression that guides viewer understanding
- Incorporate comparative elements to provide context
- Balance technical accuracy with visual appeal
Remember that the ultimate goal of marketing data visualization is not just to display numbers but to inspire action. A truly effective visualization should immediately communicate value, highlight opportunities, and provide clear direction for future marketing strategies.
Consider your visualization as a strategic communication tool. It should be accessible to both technical experts and non technical stakeholders, translating complex marketing performance data into clear, actionable insights that drive business decision making.
Frequently Asked Questions
What are the key components of an effective marketing report?
An effective marketing report typically includes an executive summary, performance metrics, campaign analysis, comparative data, and strategic recommendations to convey insights clearly and drive decision-making.
How should I choose the right format for my marketing report?
Select a report format based on your audience’s needs, such as high-level summaries for executives and detailed analyses for the marketing team, while ensuring clarity and actionable insights.
What visualization techniques should I use in my marketing report?
Consider using line graphs for trends, bar charts for comparisons, pie charts for distributions, and interactive dashboards for real-time data exploration to effectively communicate your marketing data.
How do I create a compelling executive summary for my marketing report?
A compelling executive summary should distill the report’s key points into 250-300 words, focusing on primary objectives, key results, and recommended next steps to engage busy stakeholders immediately.
Transform Your Marketing Reporting with Reportz.io
Feeling overwhelmed by the intricacies of crafting an effective marketing report? You’re not alone. As highlighted in the article, understanding your audience’s needs and tailoring report formats can be a daunting task—one that requires both time and expertise. Yet, a well-structured report can unlock decision-making power and propel your marketing strategies forward.
Imagine a world where you can create customizable KPI dashboards in under three minutes, integrating real-time data from your favorite analytics tools without sacrificing ease of use. With Reportz.io, you’ll transform complexity into clarity, allowing you to focus on what truly matters—strategic execution. Forget the tedious reporting processes that drain your productivity; our platform automates these tasks so you can spend your time where it counts most.
👉 Ready to elevate your reporting game? Don’t let inefficiency hold you back! Start your free trial at Reportz.io today and discover how effortless reporting can lead to faster, more informed decision-making and ultimate marketing success.
Recommended Articles
- 8 Essential SEO KPIs for Measuring Campaign Success – Reportz
- The Ultimate Report for E-commerce Clients – Reportz
- The Ultimate Guide to Automating Marketing Reports – Reportz
- Integrating Marketing Performance Tracking Tools for Comprehensive Insights – Reportz
- Leveraging Display Advertising Analytics for Better ROI Decisions – Reportz