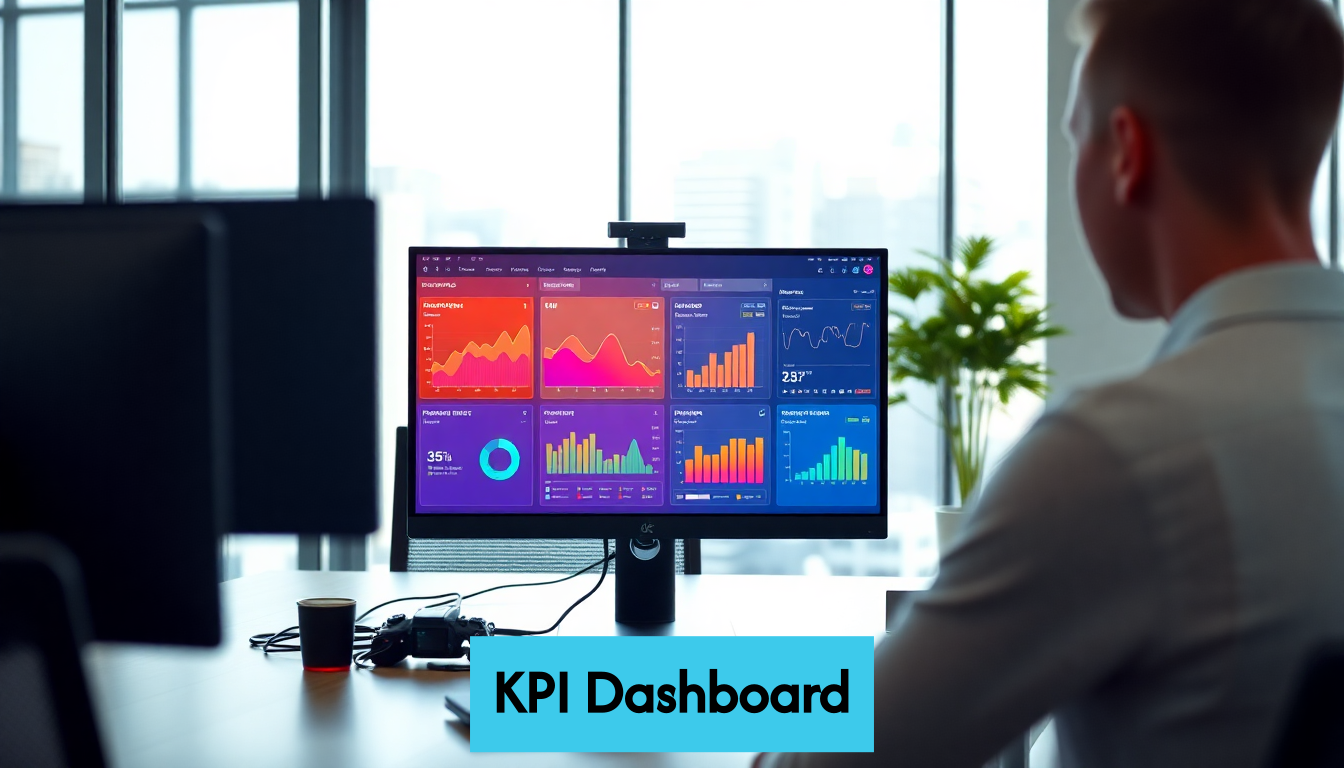
KPI dashboards are game changers in the world of business. They consolidate important metrics that drive success, making data accessible at a glance. But here’s the kicker: their visual appeal is only half the story. These dashboards empower teams to uncover meaningful insights, transforming data into actionable strategies that lead to results. With organizations that involve employees in dashboard development seeing up to 30 percent higher performance improvements, the benefits are clear. Let’s dive deeper into how these powerful tools can redefine your decision-making approach.

Understanding KPI Dashboard Benefits
In today’s data-driven business landscape, measuring performance effectively has become critical to success. Key Performance Indicator (KPI) dashboards have emerged as essential tools for organizations seeking to monitor, analyze, and improve their performance metrics in real-time. But what exactly makes these visual management systems so valuable?
Centralizing Critical Metrics
KPI dashboards serve as information command centers, bringing together vital metrics from across your organization into a single, accessible interface. Rather than hunting through spreadsheets, reports, and databases, decision-makers gain immediate access to the most important performance indicators.
This centralization transforms how teams interact with data. When critical information lives in one place, everyone works from the same source of truth. Marketing teams can track campaign performance alongside sales outcomes and customer satisfaction scores, enabling them to see connections between different business areas that might otherwise remain hidden.
According to research on implementing KPI dashboards in manufacturing, organizations that involve employees in dashboard development see significantly higher adoption rates and more meaningful performance improvements research from MDPI. This collaborative approach ensures the metrics displayed are truly relevant to daily operations.
Enabling Data-Driven Decision Making
The primary purpose of any KPI dashboard is to facilitate better decision-making. By presenting current performance data visually and contextually, dashboards empower leaders to make choices based on evidence rather than instinct.
Consider a digital marketing team reviewing their dashboard during a weekly strategy meeting. They can immediately spot which channels drive the highest conversion rates, which content pieces generate the most engagement, and where budget adjustments might yield better results. These insights allow for nimble, responsive strategy shifts that would be impossible when relying on monthly or quarterly reports.
When data visualization is done right, it reveals patterns and trends that raw numbers can’t communicate effectively. The human brain processes visual information 60,000 times faster than text, making well-designed dashboards particularly powerful for quick analysis and decision support.
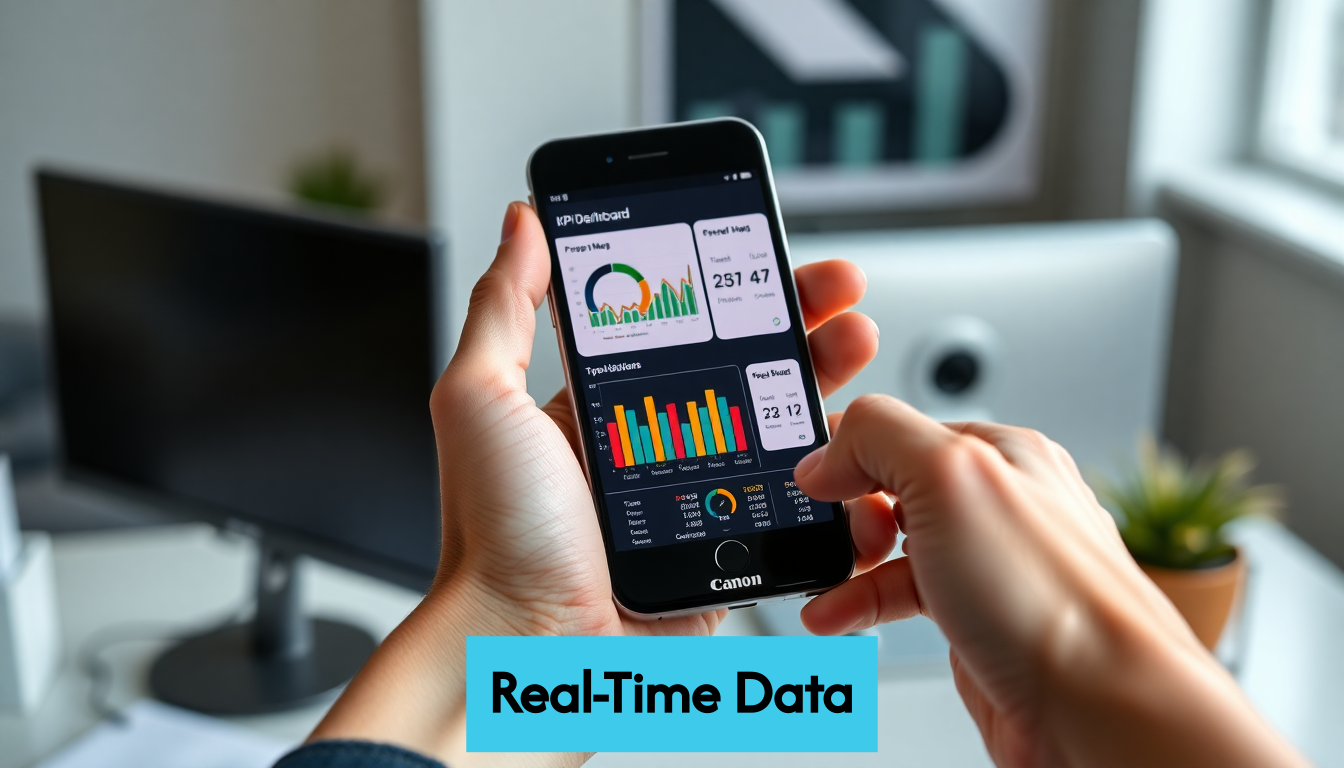
Tracking Progress Toward Goals
KPI dashboards excel at visualizing progress toward organizational objectives. By displaying targets alongside current performance metrics, they create a constant awareness of where teams stand relative to their goals.
This visibility serves multiple purposes:
- It motivates teams by making achievements visible and recognizable
- It creates accountability by clearly showing where performance falls short
- It enables proactive management by revealing potential issues before they become serious problems
The psychological impact of this visibility shouldn’t be underestimated. When teams can see their progress toward meaningful targets, they naturally adjust their efforts to close gaps and capitalize on opportunities. This creates a performance-oriented culture where continuous improvement becomes the norm rather than the exception.
Effective KPI dashboards don’t just show where you are—they help clarify where you’re heading. By establishing this visual connection between daily activities and strategic objectives, organizations create alignment that drives consistent progress toward their most important goals.
Key Takeaways
| Takeaway | Explanation |
|---|---|
| Centralize Critical Metrics | KPI dashboards consolidate vital metrics into one interface, enabling teams to work from a common source of truth, improving collaboration and decision-making. |
| Enable Data-Driven Decision Making | Dashboards provide visual, contextual data that empower leaders to make evidence-based decisions quickly, revealing patterns and trends that raw data cannot. |
| Focus on Actionable Metrics | Distinguish between vanity metrics and actionable KPIs; the latter drive business growth and inform specific, strategic decisions that can be acted upon. |
| Utilize Real-Time Data | Real-time dashboards enable immediate insights, allowing organizations to respond to emerging trends and prevent issues before they escalate, enhancing overall agility. |
| Establish North Star Metrics | Select clear, sensitive North Star metrics that reflect core business value, guiding decision-making and helping track progress towards organizational goals. |
Streamline Data For Clear Insights
In today’s business environment, organizations are drowning in data while starving for actionable insights. The sheer volume of information collected can quickly become overwhelming without proper organization and presentation. This is where KPI dashboards truly shine – by transforming raw data into clear, digestible visual insights that drive better decision-making.
From Data Overload to Focused Intelligence
Many organizations struggle with what we might call the “spreadsheet syndrome” – countless rows and columns of numbers that, while containing valuable information, make it nearly impossible to identify patterns or extract meaningful conclusions efficiently. KPI dashboards solve this fundamental problem by filtering out noise and highlighting what truly matters.
The process begins with thoughtful data curation. Not every metric deserves dashboard real estate. By selecting only the most relevant KPIs that align with strategic objectives, you create a focused view that prevents information overload. This selective approach doesn’t mean ignoring data – it means prioritizing what’s most valuable for specific decision contexts.
According to research on data quality, poor data management costs organizations an average of $15 million annually, with overall costs reaching an estimated $3.1 trillion per year in the US alone as reported by IBM and Gartner. These staggering figures highlight why streamlining data through effective dashboards isn’t just convenient – it’s economically essential.
Visual Processing for Faster Comprehension
The human brain processes visual information remarkably faster than text or raw numbers. When data is transformed into charts, graphs, and other visual elements, patterns and relationships become immediately apparent that might otherwise require extensive analysis to uncover.
Effective KPI dashboards leverage this cognitive advantage by presenting information visually. A well-designed line chart can instantly reveal trends that would be obscured in a data table. Color-coded indicators can signal performance status at a glance. Spatial relationships between elements can demonstrate correlations between different metrics that textual descriptions would struggle to convey.
This visual processing advantage translates directly into business value. When decision-makers can rapidly interpret data, they spend less time figuring out what the numbers mean and more time determining appropriate actions. In fast-moving markets where timing is critical, this efficiency can provide a significant competitive edge.
Contextual Presentation for Meaningful Analysis
Data without context is just numbers. KPI dashboards excel at providing the necessary context that transforms raw figures into meaningful insights. This contextual presentation takes several forms:
- Comparative references that show performance against targets, previous periods, or industry benchmarks
- Trend indicators that reveal directional movement beyond single data points
- Relationship visualization that demonstrates how different metrics influence each other
- Hierarchical views that allow users to drill down from high-level summaries to specific details
By integrating these contextual elements, dashboards help answer not just “what” is happening but “why” it might be happening. For instance, a marketing dashboard might show declining conversion rates alongside increased competition in paid search auctions, immediately suggesting a potential causal relationship.
When data is streamlined and presented with proper context, it transforms from an administrative burden into a strategic asset. Teams spend less time gathering and organizing information and more time applying insights to improve performance. This efficiency doesn’t just save time – it fundamentally changes how organizations relate to their data, making it an active driver of business decisions rather than a passive record of past activities.
Enhance Decisions With Real-Time Data
In today’s fast-paced business environment, the ability to make timely decisions can mean the difference between capitalizing on opportunities and missing them entirely. KPI dashboards that leverage real-time data provide decision-makers with the most current information available, enabling them to respond to changing conditions promptly and confidently.
The Power of Immediacy
Traditional reporting cycles often introduce significant delays between when events occur and when they’re analyzed. Monthly reports might provide insights about January’s performance halfway through February, by which time the information may be too outdated to guide effective action. Real-time KPI dashboards eliminate this lag, delivering insights as events unfold.
This immediacy creates a fundamentally different decision-making environment. Consider a digital marketing campaign that suddenly stops performing well. With traditional reporting, you might waste significant budget before recognizing the problem. With real-time dashboards, you can identify the performance drop immediately and take corrective action—pausing the campaign, adjusting targeting parameters, or reallocating budget to better-performing channels—before substantial resources are wasted.
Large organizations like Uber demonstrate the value of real-time data processing at scale. According to their engineering team, they process “trillions of messages and petabytes of data daily” to fuel immediate decision-making across their platform as detailed in their infrastructure documentation. While most businesses operate at smaller scales, the principle remains the same: fresher data leads to more relevant decisions.
Agility in Responding to Trends
Real-time KPI dashboards excel at revealing emerging trends as they develop rather than after they’ve become established patterns. This early detection capability provides a significant competitive advantage, allowing organizations to respond proactively rather than reactively.
For marketing teams, this might mean spotting a sudden increase in engagement with specific content topics and quickly producing more material on those subjects. For e-commerce businesses, it could involve identifying products gaining unexpected traction and adjusting inventory or promotional strategies accordingly. The ability to pivot based on actual performance data—rather than forecasts or historical patterns—creates remarkable business agility.
This agility isn’t just about responding to positive trends. Real-time dashboards also serve as early warning systems for potential problems. When key metrics begin trending in the wrong direction, teams can investigate and address root causes before they develop into serious issues. This preventive capability often proves even more valuable than the ability to capitalize on positive developments.
Continuous Performance Optimization
Real-time KPI dashboards fundamentally change how organizations approach performance optimization. Rather than making periodic adjustments based on retrospective analysis, teams can implement a continuous improvement model driven by current data.
This approach is particularly valuable in areas like:
- Digital advertising where bid strategies and creative elements can be adjusted throughout the day
- Website optimization where user behavior data can guide immediate UX improvements
- Customer service where real-time satisfaction metrics can trigger immediate process adjustments
- Supply chain management where inventory levels and delivery times can be constantly monitored
The power of continuous optimization compounds over time. Small adjustments made daily or weekly ultimately produce more significant improvements than major overhauls conducted quarterly or annually. Real-time dashboards make this incremental approach possible by providing the constant feedback necessary to guide these frequent refinements.
By embracing real-time data through well-designed KPI dashboards, organizations create a more responsive business culture—one where decisions are guided by current realities rather than historical patterns. This approach doesn’t diminish the value of historical data for identifying long-term trends, but it complements that analysis with immediate insights that enable swift, confident action in the moment.
Drive Growth Through Actionable Metrics
Not all metrics are created equal. The true power of KPI dashboards lies not just in displaying data, but in focusing on metrics that directly drive business growth through clear, actionable insights. Understanding the difference between vanity metrics and truly actionable KPIs is essential for creating dashboards that deliver measurable business value.
Beyond Vanity Metrics
Many organizations fall into the trap of tracking what’s easy to measure rather than what genuinely matters. Page views, social media followers, and email open rates might look impressive on a dashboard, but they often fail to correlate with business success. These vanity metrics provide a false sense of progress while offering limited guidance for meaningful action.
Actionable metrics, by contrast, directly connect to business outcomes and provide clear direction for improvement. They answer specific questions about customer behavior, operational efficiency, or financial performance that can guide concrete decisions. The key difference is that actionable metrics don’t just tell you what happened—they help you understand why it happened and what you should do next.
For digital marketers, this might mean shifting focus from total traffic to conversion rates by traffic source, allowing them to double down on channels that actually generate customers rather than just visitors. For product teams, it could involve prioritizing retention metrics over download counts, focusing efforts on creating lasting value rather than fleeting initial interest.
Selecting North Star Metrics
Effective KPI dashboards typically organize metrics in a hierarchy, with one or a small handful of “North Star” metrics at the top. These primary indicators reflect the core value your business delivers and serve as the ultimate measure of success.
Choosing the right North Star metrics requires careful consideration. According to research on optimization metrics, many organizations struggle with North Star metrics that are too insensitive to detect small improvements, potentially slowing down product development and growth as detailed in a study on metric sensitivity. The study found that by identifying more responsive proxy metrics that still predict long-term business outcomes, teams could make decisions up to eight times faster.
When selecting North Star metrics for your dashboard, consider these criteria:
- Does it reflect real business value (revenue, profit, customer retention)?
- Is it sensitive enough to show meaningful changes over relevant time periods?
- Does it align with your company’s strategic objectives?
- Can it be influenced by specific team actions?
Once you’ve identified your North Star, you can work backward to identify the supporting metrics that drive its performance, creating a logical framework for growth-oriented decision making.
Creating Metrics That Drive Action
To transform dashboard data into business growth, metrics must be designed with action in mind. This means considering not just what you measure, but how you structure and present those measurements to encourage specific behaviors.
Actionable metrics share several key characteristics:
- Comparative context that shows performance relative to goals, historical trends, or benchmarks
- Appropriate granularity that balances big-picture understanding with detailed insights
- Clear ownership that assigns responsibility for specific metrics to individuals or teams
- Accessible presentation that makes complex data understandable to decision-makers
Consider a simple example: displaying month-over-month website conversion rate without context provides limited value. But showing the same metric with year-over-year comparison, broken down by traffic source, and displayed alongside the goal creates immediate clarity about performance gaps and opportunities for improvement.
When metrics are structured to highlight actionable insights, they naturally prompt the right questions: “Why did social media conversions drop this month?” “What changed in our email campaigns that improved their performance?” “How can we apply what’s working in one channel to improve others?” These questions lead directly to targeted experiments and improvements that drive measurable business growth.
The most effective KPI dashboards create a virtuous cycle where metrics guide actions, actions improve performance, and improved performance validates the metrics themselves. By focusing on truly actionable indicators rather than surface-level statistics, organizations transform their dashboards from passive monitoring tools into active engines for continuous growth.
Frequently Asked Questions
What is a KPI dashboard?
A KPI dashboard is a visual management tool that consolidates key performance indicators into a single interface, helping organizations monitor, analyze, and improve their performance metrics in real-time.
How do KPI dashboards improve decision-making?
KPI dashboards enable data-driven decision-making by presenting current performance data visually and contextually, allowing leaders to make informed decisions based on evidence rather than instinct.
What are actionable metrics in a KPI dashboard?
Actionable metrics are key performance indicators that directly drive business growth and provide clear direction for improvement. They help organizations understand why certain outcomes occurred and what actions to take next.
Why is real-time data important in KPI dashboards?
Real-time data in KPI dashboards allows decision-makers to receive immediate insights, enabling them to respond to emerging trends and issues quickly, which enhances overall agility in business operations.
Unleash Your Data’s Full Potential with Reportz
Are you tired of wrestling with massive spreadsheets, trying to untangle key insights while critical decisions hang in the balance? The struggle for clear, actionable metrics is a common pain point highlighted in our discussion on the transformative power of KPI dashboards. With Reportz.io, you can streamline your reporting process, effortlessly transforming your data into the success stories your business deserves.
Imagine creating a personalized KPI dashboard with real-time metrics from all your marketing channels in under three minutes! With our easy-to-use platform, the days of data overload are officially behind you. Instead, focus on what truly matters: strategy and execution. Don’t let your invaluable insights collect dust– take charge of your data today! Start maximizing your efficiency with Reportz by visiting https://reportz.io now and witness the change firsthand. Your time is valuable—let’s spend it wisely!
Recommended Articles
- Maximizing Your Marketing: The Benefits of Using an SEO Reporting Tool – Reportz
- 8 Essential SEO KPIs for Measuring Campaign Success – Reportz
- Reportz and LinkedIn Social Integration – All That LinkedIn has to Offer in One Dashboard – Reportz
- Top Resources & Communities for Digital Agency Owners & Entrepreneurs – Reportz