
Most companies think their marketing dashboard is set once the charts are live. What a shock when you realize that over 70 percent of dashboards fail to deliver clear, actionable insights. The real secret is not in collecting more data, but in choosing the right metrics and presenting them so well your team can act instantly. Here is how a smart dashboard setup can turn piles of raw numbers into a tool your team actually depends on.
Table of Contents
- Define Your Marketing Dashboard Goals
- Choose And Connect Your Data Sources
- Build And Design Your Dashboard Layout
Quick Summary
| Takeaway | Explanation |
|---|---|
| Define Clear Goals | Establishing specific objectives is crucial for effective dashboard setup, ensuring it serves as a strategic tool rather than just a collection of data. |
| Select Appropriate KPIs | Identify critical performance indicators that align with business objectives to effectively measure marketing success. |
| Data Source Reliability | Use reliable data sources and ensure stable integration to maintain data accuracy, which is essential for actionable insights. |
| Focus on User Experience | Design dashboards with user-friendly layouts, ensuring clarity and readability through strategic visual hierarchy and interactive elements. |
| Iterative Design Process | Regularly review and refine the dashboard based on user feedback to ensure it adapts to changing needs and continues to provide relevant insights. |
Define Your Marketing Dashboard Goals
Successful marketing dashboard setup begins with crystal clear goal definition. Your dashboard is not just a collection of charts and numbers. It is a strategic tool that transforms raw data into actionable insights for your marketing team.
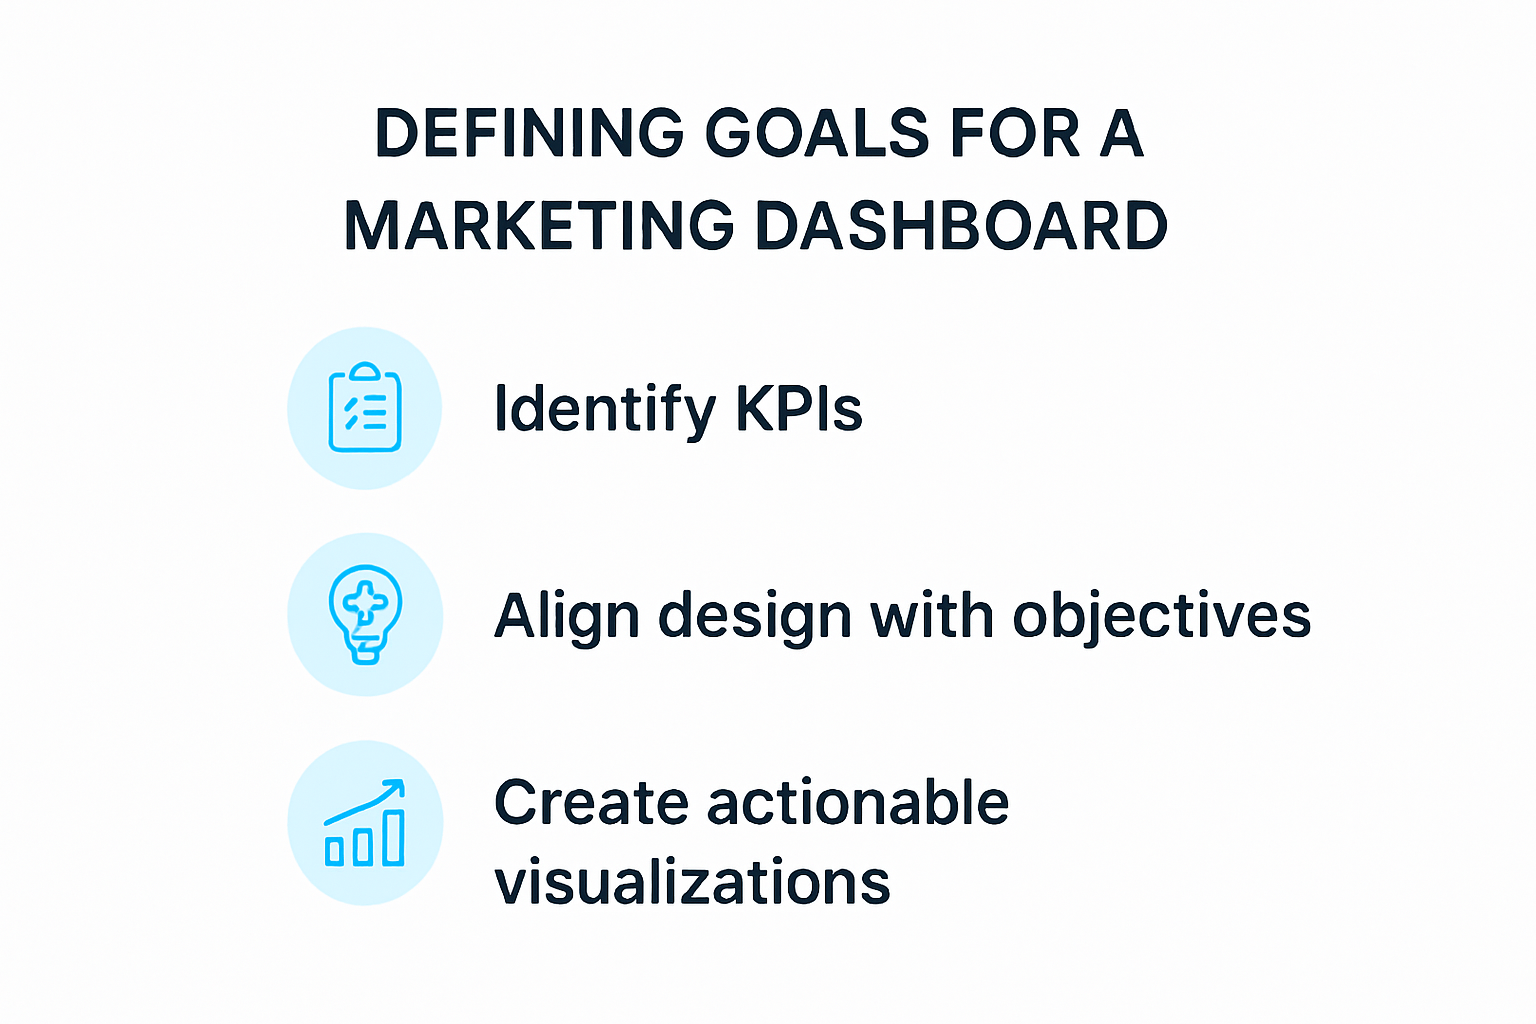
Identify Key Performance Indicators (KPIs)
Before building your marketing dashboard, you must pinpoint the most critical metrics that directly reflect your business objectives. These KPIs act as your marketing performance compass. According to UI Bakery’s marketing dashboard guide, effective dashboards connect multiple data sources to provide comprehensive tracking.
Consider the following key areas for KPI selection:
- Customer Acquisition: Track metrics like cost per lead, conversion rates, and total new customers
- Revenue Impact: Monitor marketing qualified leads, sales generated from marketing campaigns
- Channel Performance: Analyze engagement rates across different marketing channels
Align Dashboard Design with Strategic Objectives
Your marketing dashboard should reflect your specific business goals. UX design principles recommend a hierarchical approach where the most critical data points appear prominently at the top of the dashboard.
This strategic alignment means different organizations will have unique dashboard configurations. A B2B technology company might prioritize lead generation metrics, while an ecommerce brand could focus more on conversion rates and average order value.
Key considerations for goal-oriented dashboard design include:
- Matching visualization types to specific data storytelling needs
- Ensuring data sources provide real time or near real time updates
- Creating intuitive layouts that enable quick decision making
Create Actionable Visualization Strategies
Transforming data into meaningful insights requires more than just displaying numbers. Your marketing dashboard setup must enable immediate understanding and prompt strategic action.
Effective dashboards go beyond simple reporting. They provide context, highlight trends, and make complex information digestible. By using color coding, trend lines, and comparative visualizations, you can help team members quickly interpret performance metrics.
For maximum impact, your dashboard should:
- Highlight performance gaps
- Show progress toward predefined goals
- Enable drill down capabilities for deeper analysis
Building a marketing dashboard is not a one time event. Treat it as an evolving tool that adapts to your changing business landscape. Regularly review and refine your dashboard to ensure it continues delivering the most relevant and impactful insights for your marketing strategy.
Choose And Connect Your Data Sources
Selecting the right data sources is critical for creating a powerful marketing dashboard. Your dashboard will only be as good as the data sources you integrate, making this step fundamental to your marketing intelligence strategy.

Identify Comprehensive Data Collection Channels
A robust marketing dashboard requires pulling data from multiple platforms to create a holistic view of your marketing performance. Salesforce’s marketing analytics guide recommends connecting sources across various marketing channels to capture a complete picture of customer interactions.
Key data sources to consider include:
- Digital Advertising Platforms: Google Ads, Facebook Ads, LinkedIn Ads
- Social Media Analytics: Instagram Insights, Twitter Analytics, Facebook Insights
- Email Marketing Tools: Mailchimp, Constant Contact, HubSpot
- Web Analytics: Google Analytics, Adobe Analytics
- Customer Relationship Management (CRM): Salesforce, HubSpot CRM
Ensure Data Integration Reliability
Connecting multiple data sources requires careful attention to integration quality. Whatagraph’s reporting tool analysis emphasizes the importance of secure and stable data connections that maintain 100% accuracy.
Consider these critical integration factors:
- Data synchronization frequency
- Authentication and security protocols
- Compatibility between different platforms
- Real-time data collection capabilities
Implement Data Cleansing And Validation
Raw data is rarely perfect. Your marketing dashboard setup must include robust data cleansing processes to ensure accuracy and reliability. This means removing duplicates, correcting formatting issues, and standardizing data across different sources.
Effective data preparation involves:
- Automated error detection
- Consistent data formatting
- Regular data quality audits
- Removing incomplete or irrelevant data points
Professional tip: Not all data sources are created equal. Some platforms offer more detailed analytics than others. Prioritize sources that provide granular insights and support your specific marketing goals.
Choosing the right data sources is an ongoing process. Technology evolves rapidly, and new marketing tools emerge constantly. Plan to review and update your data sources periodically to ensure your marketing dashboard remains a powerful decision-making tool.
Remember that the goal is not to collect as much data as possible, but to collect meaningful data that directly supports your marketing strategy. Quality always trumps quantity when it comes to marketing intelligence.
Build And Design Your Dashboard Layout
Designing an effective marketing dashboard layout transforms raw data into a compelling visual narrative that drives strategic decision making. Your dashboard is more than a collection of charts it is a strategic communication tool that must balance information density with clarity and visual appeal.
Create a Strategic Visual Hierarchy
Dashboard design experts at Improvado emphasize the importance of clear labels and consistent design elements that enable quick insights. The layout should guide the viewer’s eye naturally through the most important information.
Key principles of visual hierarchy include:
- Position critical KPIs and summary metrics at the top of the dashboard
- Use size and color to draw attention to most significant data points
- Arrange related metrics in logical visual clusters
- Maintain consistent spacing and alignment across visualization elements
Optimize for User Experience and Readability
A well designed marketing dashboard prioritizes immediate comprehension. Fuselab Creative’s design trends research highlights the growing importance of mobile first designs and intuitive user interfaces.
Consider these user experience strategies:
- Use color coding to represent performance status (green for positive, red for negative)
- Select chart types that match the data being presented
- Ensure sufficient white space to prevent visual clutter
- Design with scalability in mind for different screen sizes
Implement Responsive And Interactive Design
Modern marketing dashboards are not static reports. They should offer interactive elements that allow users to drill down into specific metrics, filter data, and customize their view.
Interactive design features to incorporate:
- Clickable chart elements
- Dynamic date range selectors
- Ability to zoom and expand specific data segments
- Hover states that reveal additional context
Remember that dashboard design is an iterative process. What works today might need adjustment tomorrow. Regularly collect feedback from dashboard users and be prepared to refine your layout based on their input.
Your goal is to create a dashboard that tells a clear story at a glance. Each visualization should answer a specific business question quickly and intuitively. Avoid the temptation to include every possible metric. Instead, focus on the data points that drive meaningful action and strategic insights.
A truly effective marketing dashboard does more than display numbers. It provides a narrative of your marketing performance, highlights opportunities for improvement, and empowers your team to make data driven decisions with confidence.
Frequently Asked Questions
What are the key steps for setting up a marketing dashboard?
Successful marketing dashboard setup involves defining clear goals, identifying key performance indicators (KPIs), choosing reliable data sources, and designing a user-friendly layout.
How do I choose the right KPIs for my marketing dashboard?
Select KPIs that align with your business objectives, such as customer acquisition metrics, revenue impacts, and channel performance to effectively measure marketing success.
Why is data integration important for my marketing dashboard?
Data integration ensures that your dashboard pulls together accurate and relevant information from multiple sources, enabling holistic insights critical for informed decision-making.
How can I improve the user experience of my marketing dashboard?
Enhance user experience by focusing on readability, using clear visual hierarchy, employing interactive elements, and ensuring the design is responsive across various devices.
Transform Your Marketing Insights with Reportz.io
Found yourself stuck in the data maze? As highlighted in our guide, effective marketing dashboards should deliver clear, actionable insights—yet many fail to do so, leaving teams overwhelmed by raw numbers. With over 70% of dashboards not meeting expectations, it’s crucial to streamline your approach. That’s where Reportz.io steps in!
Imagine a world where you can customize your own KPIs, integrate reliable data sources, and create stunning visual hierarchies in under three minutes. Experience real-time performance metrics right at your fingertips, so your team can shift their focus from tedious data handling to crafting powerful marketing strategies. Stop letting data overwhelm you and start harnessing it to drive your success. 💡 Why wait?
Get started now with Reportz.io and unlock a more efficient reporting process. Head over to Reportz.io and transform how your team makes data-driven decisions. Your ideal marketing dashboard awaits!