Data reporting is essential for today’s businesses navigating an ocean of information. With over 80 percent of business leaders citing data-driven insights as key to their decision-making, this process has never been more critical. But here’s the twist: despite this overwhelming reliance on data, many organizations struggle to present their findings in a way that truly resonates. The reality is that effective data reporting combines clear narratives with strategic visualization, transforming raw numbers into compelling stories that drive action.
Table of Contents
- Understanding The Core Of Data Reporting
- Key Benefits Of Effective Data Reporting
- Different Types Of Data Reports Explained
- Essential Tips For Better Data Reporting
Quick Summary
| Takeaway | Explanation |
|---|---|
| Clear Data Reporting is Key for Decision-Making | Effective data reporting translates complex datasets into actionable insights, enabling organizations to make informed decisions swiftly and accurately. |
| Different Types of Reports Serve Unique Purposes | Organizations must understand various report types—operational, analytical, and compliance—to meet specific needs and communicate insights effectively. |
| Data Quality is Crucial for Reliability | Ensuring data quality involves consistent collection methodologies, regular validation processes, and transparent documentation to enhance the reliability of reporting. |
| Data Storytelling Enhances Engagement | Crafting clear narratives around data helps make complex information engaging and understandable, fostering better insights and decision-making. |
| Effective Visualization Improves Comprehension | Choosing appropriate visualization strategies can significantly enhance the understanding of data, making it easier for stakeholders to digest insights. |
Understanding the Core of Data Reporting
Data reporting transforms raw information into meaningful insights that drive strategic decision-making across industries. At its fundamental core, data reporting is a systematic process of collecting, organizing, and presenting data in a way that reveals critical patterns, trends, and actionable intelligence.
What Exactly is Data Reporting?
Data reporting is more than simply presenting numbers. It’s a strategic communication method that translates complex datasets into clear, comprehensible narratives. Effective data reporting bridges the gap between raw information and practical understanding, enabling organizations to make informed decisions quickly and accurately.
The process involves several critical components:
- Data Collection: Gathering relevant information from various sources
- Data Analysis: Examining and interpreting the collected data
- Data Visualization: Presenting findings through charts, graphs, and other visual representations
According to research from the National Institutes of Health, data reporting is fundamentally about preparing and disseminating research findings with accuracy and integrity. This means ensuring that the information presented is not just comprehensive, but also reliable and meaningful.
The Strategic Importance of Data Reporting
In today’s data-driven world, organizations rely on robust reporting mechanisms to:
- Track performance metrics
- Identify emerging trends
- Make evidence-based strategic decisions
- Communicate complex information clearly
Research from data management experts highlights that data reporting goes beyond mere number-crunching. It involves interpreting gathered data through analytical reasoning, identifying intricate patterns and relationships that might not be immediately apparent.
For digital marketers, marketing agencies, and businesses, data reporting becomes a critical tool for understanding customer behavior, measuring campaign effectiveness, and driving strategic initiatives. It transforms abstract numbers into concrete insights that can guide investment, product development, and marketing strategies.
Key Components of Robust Data Reporting
A comprehensive data report typically includes:
- Clear, concise data summaries
- Contextual explanations of findings
- Visual representations like charts and graphs
- Actionable recommendations based on data insights
The goal is not just to present data, but to tell a story that enables quick, informed decision-making. Whether you’re tracking marketing campaign performance, analyzing customer engagement, or evaluating business growth, effective data reporting turns complex information into understandable, strategic intelligence.
By understanding the core principles of data reporting, organizations can transform raw data into powerful tools for innovation, strategic planning, and competitive advantage.
Key Benefits of Effective Data Reporting

Effective data reporting goes beyond simply presenting numbers—it serves as a strategic powerhouse that drives organizational success, enhances decision-making, and unlocks hidden potential within complex datasets. By transforming raw information into actionable insights, businesses can gain significant competitive advantages across multiple dimensions.
Enhanced Decision-Making Capabilities
Data reporting empowers organizations with precision-driven decision-making capabilities. Strategic intelligence derived from comprehensive data analysis allows leaders to move beyond intuition and base their choices on concrete evidence. According to research from Harvard Business Review, companies that integrate data-driven decision-making are 5-6% more productive and profitable compared to their competitors.
Key decision-making improvements include:
- Rapid identification of emerging market trends
- Accurate performance measurement
- Risk mitigation through predictive analytics
- Evidence-based strategic planning
Operational Efficiency and Performance Optimization
Data reporting serves as a critical mechanism for streamlining organizational workflows and identifying improvement opportunities. Experts from McKinsey & Company suggest that organizations leveraging comprehensive data reporting can reduce operational costs by up to 20% while simultaneously improving overall performance.
Operational benefits encompass:
- Identifying inefficient processes
- Tracking key performance indicators (KPIs)
- Automating routine reporting tasks
- Creating transparent performance benchmarks
Competitive Intelligence and Strategic Insights
In today’s rapidly evolving business landscape, data reporting provides a crucial competitive edge. By systematically collecting, analyzing, and presenting data, organizations can uncover hidden patterns, predict market shifts, and develop proactive strategies.
Research from Gartner indicates that organizations with robust data reporting mechanisms are 3 times more likely to experience significant improvements in customer engagement and market positioning. This translates into tangible benefits such as:
- Enhanced customer understanding
- More targeted marketing strategies
- Improved product development
- Better resource allocation
Effective data reporting is not just a technical process—it’s a strategic approach that transforms raw information into organizational intelligence. By embracing comprehensive reporting methodologies, businesses can unlock unprecedented levels of insight, efficiency, and competitive advantage.
Whether you’re a digital marketer tracking campaign performance, a startup measuring growth metrics, or an enterprise-level organization monitoring complex systems, data reporting provides the clarity and strategic perspective needed to navigate today’s complex business environment.
Different Types of Data Reports Explained
Data reporting isn’t a one-size-fits-all approach. Different organizational needs, industry requirements, and strategic objectives demand diverse reporting methodologies. Understanding the various types of data reports enables businesses to communicate insights effectively and make informed decisions.
Operational Performance Reports
Operational performance reports provide real-time snapshots of an organization’s day-to-day functioning. These reports focus on immediate metrics, tracking critical performance indicators that drive business efficiency. Research from Gartner indicates that companies using detailed operational reports can improve productivity by up to 25%.
Key characteristics of operational performance reports include:
- Granular, time-sensitive data
- Immediate actionable insights
- Metrics related to specific departments or processes
- Short-term performance tracking
Analytical and Strategic Reports
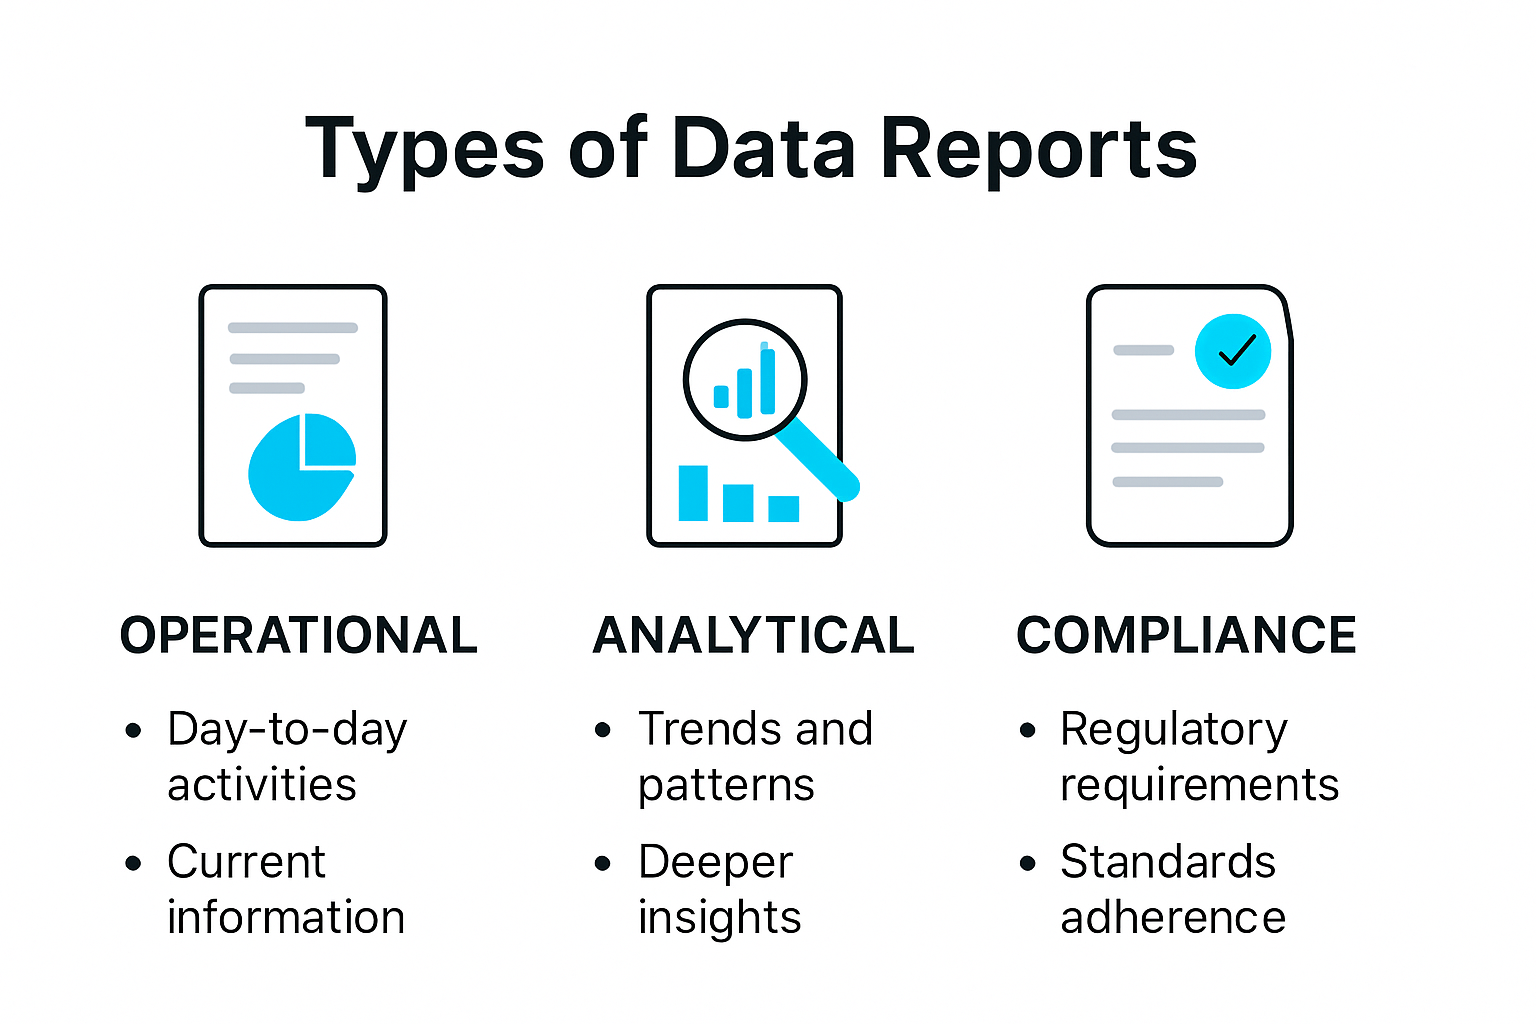
Analytical reports represent a deeper dive into complex data landscapes. Unlike operational reports, these provide comprehensive insights that support long-term strategic planning. McKinsey & Company suggests that strategic reports help organizations identify emerging trends, predict future scenarios, and develop robust decision-making frameworks.
Typical components of analytical reports include:
- Trend analysis
- Predictive modeling
- Comprehensive data visualization
- Cross-departmental insights
- Long-term strategic recommendations
Compliance and Regulatory Reports
In highly regulated industries, compliance reports are critical. According to the National Institute of Standards and Technology, these reports ensure organizations meet stringent legal and industry-specific requirements. Compliance reports demonstrate adherence to standards like GDPR, HIPAA, and SOX, protecting organizations from potential legal risks.
Key aspects of compliance reports encompass:
- Detailed documentation of data handling practices
- Evidence of regulatory adherence
- Audit trails and verification mechanisms
- Risk mitigation strategies
- Transparent reporting of potential vulnerabilities
The diversity of data reporting reflects the complex needs of modern organizations. From real-time operational tracking to strategic long-term analysis and regulatory compliance, each report type serves a unique purpose. Digital marketers, agencies, and businesses must select and develop reporting strategies that align with their specific goals, ensuring they transform raw data into meaningful, actionable intelligence.
By understanding and leveraging different data report types, organizations can create a comprehensive approach to data management that drives innovation, ensures compliance, and supports strategic growth.
Essential Tips for Better Data Reporting
Data reporting is an art and science that requires precision, clarity, and strategic thinking. To transform raw data into meaningful insights, professionals must master several critical techniques that elevate reporting from mere number-crunching to powerful communication tools.
Crafting Clear and Compelling Narratives
Data storytelling turns complex information into engaging, understandable insights. Research from Harvard Business Review emphasizes that effective data reports are not just about presenting numbers, but creating a narrative that connects data points and reveals meaningful patterns.
Key elements of compelling data narratives include:
- Contextualizing data within broader organizational goals
- Using clear, jargon-free language
- Creating logical flow between data points
- Highlighting key insights and implications
Visualization and Presentation Strategies
Visual representation dramatically improves data comprehension. According to Edward Tufte, data visualization expert, well-designed graphics can communicate complex information more effectively than text alone. Effective visualization strategies involve:
- Selecting appropriate chart types
- Using consistent color schemes
- Avoiding visual clutter
- Ensuring data accuracy in graphical representations
Professional data visualization tools like Tableau and Power BI can transform raw data into intuitive, interactive graphics that tell a clear story.
Ensuring Data Quality and Reliability
The National Institute of Standards and Technology underscores the critical importance of data integrity. Robust data reporting requires:
- Consistent data collection methodologies
- Regular data validation processes
- Transparent documentation of data sources
- Clear explanation of analytical methods
Additional best practices include:
- Cross-referencing multiple data sources
- Implementing rigorous error-checking protocols
- Maintaining comprehensive metadata
- Documenting any limitations or potential biases in the data
Successful data reporting transcends technical skill—it’s about creating a bridge between complex information and human understanding. By focusing on clarity, storytelling, and precision, professionals can transform data from raw numbers into strategic insights that drive meaningful decision-making.
Whether you’re a digital marketer tracking campaign performance, a business analyst exploring market trends, or a researcher presenting scientific findings, mastering these data reporting techniques will elevate your ability to communicate complex information effectively and persuasively.
Frequently Asked Questions
What is data reporting?
Data reporting is the systematic process of collecting, organizing, and presenting data to reveal critical patterns, trends, and actionable intelligence. It transforms raw information into clear narratives to support decision-making.
Why is data reporting important for businesses?
Data reporting is vital for businesses because it enhances decision-making capabilities, improves operational efficiency, and provides competitive intelligence. It allows organizations to track performance, identify trends, and make evidence-based decisions.
What are the different types of data reports?
The different types of data reports include operational performance reports, analytical and strategic reports, and compliance and regulatory reports. Each type serves unique purposes based on organizational needs and objectives.
What are best practices for effective data reporting?
Best practices for effective data reporting include crafting clear narratives, using appropriate visualization strategies, and ensuring data quality and reliability. These practices enhance comprehension and facilitate better decision-making.
Transform Data Reporting into Strategic Insights with Reportz.io
Navigating the complexities of data reporting can often feel overwhelming, especially when trying to translate complex datasets into actionable insights. As highlighted in our recent article, effective data reporting is essential for enhanced decision-making, operational efficiency, and competitive intelligence. Yet, many professionals grapple with traditional reporting processes that consume valuable time and detract from strategic initiatives.
Imagine a solution that not only simplifies this reporting challenge but also empowers you to focus on what truly matters—your marketing strategy. With Reportz.io, you can automate your reporting tasks, create customizable KPI dashboards, and integrate data from multiple marketing channels in under three minutes! This means less time wrestling with numbers and more time translating those insights into powerful strategies for growth.
Don’t let cumbersome reporting hold you back. Experience the ease of streamlined data reporting today—try Reportz.io and transform the way you communicate insights. Get started now and elevate your reporting game!